
Charts & Graphs Worksheet-1
Observe the given image carefully and answer the Q.1,2,3,4
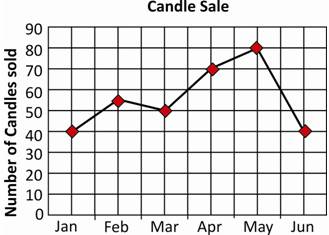
Mrs. Baker makes candles and sells them for her living. The given line chart shows how her candle sale changed from January to June in 2004.
A. 1 B. 80 C. 55 D. 50
A. 40 B. 10 C. 80 D. 45
A. Feb-Mar B. Apr-May C. May - Jun D. Jan-Feb
A. 295 B. 350 C. 335 D. 235
See the Pie Chart to answer the following Q.5,6,7,8
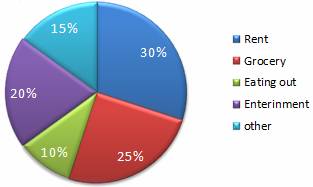
The pie chart shows how Mr. Dave distributes his monthly income into different household expenses.
A. 10% B. 20% C. 30% D. 25%
A. Grocery B. Entertainment
C. Eating out D. Rent
A. 1/4 B. 1/2 C. 1/10 D. 3/4
A. Rs.1,0000 B. Rs.2500 C. Rs.5000 D. Rs.7000
A. Bar graph B. Pictograph
C. Circle graph D. Line graph
A. Bar Chart B. Circle/Pie Chart
C. Line Chart D. Stem and Leaf plot
Answer Key:
1. (d); 2. (a); 3. (c); 4. (c); 5. (b); 6. (d); 7. (a); 8. (c); 9. (d); 10. (b)