
Charts and graphs Worksheet-2
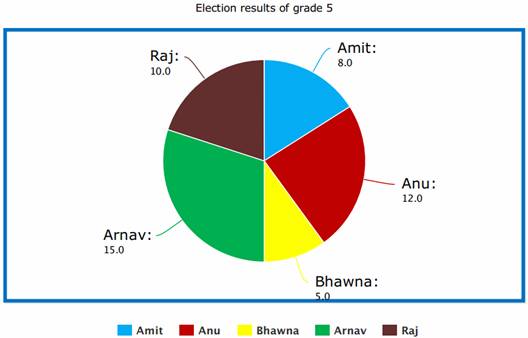
Number of votes obtained by each candidate is shown in the pie chart. Study the chart carefully and answer the questions.
(a) Arnav (b) Raj (c) Amit (d) Bhawna
(a) Arnav (b) Raj (c) Amit (d) Bhawna
(a) 5 (b) 6 (c) 7 (d) 8
(a) 1/5 (b) 2/5 (c) 3/10 (d) 4/5
(a) Amit (b) bhawna (c) Anu (d) Raj
(a) 15 (b) 12 (c) 10 (d) 8
Answer Key:
(1)-A; (2)-D; (3)-A; (4)-A; (5)-D; (6)-B