Logo

Charts and graphs Worksheet-7

Charts and graphs Worksheet-7


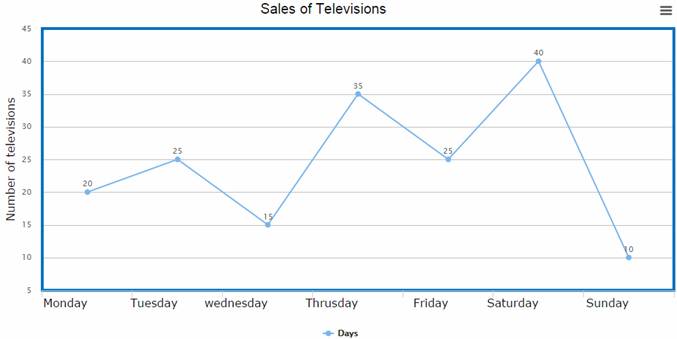
Study the graph and answer the questions.

  1. Which day had the maximum sales of televisions ?

(a) Sunday         (b) Saturday     (c) Friday          (d) Wednesday


  1. Which day had the minimum sales of televisions ?

(a) Sunday         (b) Saturday     (c) Friday          (d) Wednesday


  1. Which two days had the same sale of televisions ?

       (a) Sunday & Monday                 (b) Monday & Friday

       (c) Tuesday & Friday                  (d) Wednesday & Sunday


  1. How many televisions were sold on Friday ?

(a) 20                 (b) 25                 (c) 35                  (d) 40


  1. For how many day more than 20 televisions were sold ?

(a) 4                    (b) 3                   (c) 5                    (d) 2


  1. The days are bad when sales is less than 20. How many bad days are there?

(a) 2                    (b) 1                   (c) 3                    (d) 4


  1. Sales on Monday is _____ sales on Sunday.

       (a) Equal to                                   (b) Half of

(c) Double of                                 (d) None of these


  1. What is the difference between maximum and minimum sales ?

(a) 20                 (b) 15                  (c) 30                  (d) 25


  1. Total number of units sold in the week are _____

(a) 150                (b) 160               (c) 170                (d) 140


  1. Sales of Sunday is what fraction of total sales ?

(a) 1/17               (b) 2/85             (c) 2/17              (d) None of these


Answer Key:

(1)-B; (2)-A; (3)-C; (4)-B; (5)-A; (6)-A; (7)-C; (8)-C; (9)-C; (10)-A