
Charts and graphs Worksheet-1
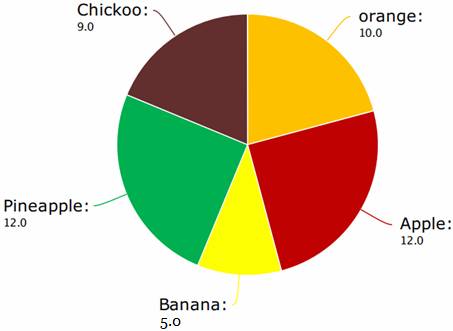
The pie diagram shows the favourite fruit of the students of class 5. Study the chart and answer the questions.
(a) Apple (b) Pineapple
(c) Apple & pineapple both (d) Banana
(a) Banana (b) orange (c) Apple (d) Pineapple
(a) 5 (b) 10 (c) 12 (d) 9
(a) 5 (b) 10 (c) 12 (d) 9
(a) 5 (b) 10 (c) 12 (d) 9
(a) 48 (b) 45 (c) 50 (d) 42
Answer Key:
(1)-C; (2)-A; (3)-C; (4)-D; (5)-A; (6)-A