
-
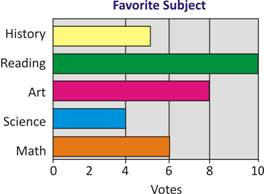
See the bar chart to answer this question. How many students choose science and math as their favorite subjects?

A. 8 B. 10 C. 6 D. 4
-
See the bar chart to answer this question. How many more students choose reading than choose math as their favorite subject?
A. 3 B. 5 C. 4 D. 6
-
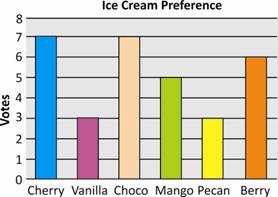
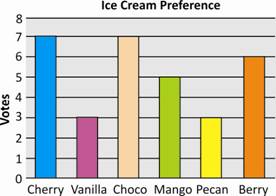
The bar graph shows favorite ice-cream flavours among the second graders. See the graph to answer this question. How many more second graders like choco flavour than vanilla flavour?
A. 3 B. 2 C. 4 D. 1
-
The bar graph shows favorite ice-cream flavours among the second graders. See the graph to answer this question. How many second graders like berry flavour?
A. 3 B. 6 C. 2 D. 5
-
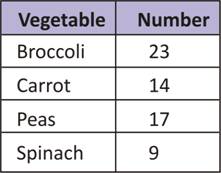
See the table to answer this question. How many more students chose broccoli than chose peas?
A. 8 B. 9 C. 6 D. 4
-
See the table to answer this question. How many students responded to the survey?
A. 64 B. 54 C. 55 D. 63
-
Shaunak went to shopping with his father and bought the number of toys listed in the table given below. See the table to answer this question. How many more blocks he bought than marbles?
A. 3 B. 9 C. 8 D. 4
-
How many people chose Ahmedabad?
A. 15 B. 13 C. 4 D. 14
-
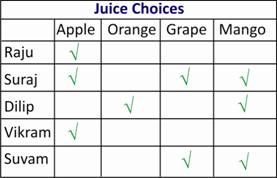
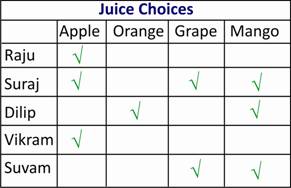
The table below shows drinks preferences by Raju, Suraj, Dilip, Vikram and Suvam. See the table to answer this question. Who likes apple juice?
A. Raju and Dilip B. Dilip and Suvam
C. Raju, Suraj and Vikram D. Suraj and Suvam
-
The bar graph shows favorite ice-cream flavours among the second graders. See the graph to answer this question. How many second graders like choco or vanilla flavours?
A. 5 B. 7 C. 8 D. 10
Answers
(1)–B; (2)–C; (3)–C; (4)–B; (5)–C; (6)–D; (7)–C; (8)–A; (9)–C; (10)–D

.jpg)
.jpg)