Logo

Charts and graphs Worksheet-11

Charts and graphs Worksheet-11


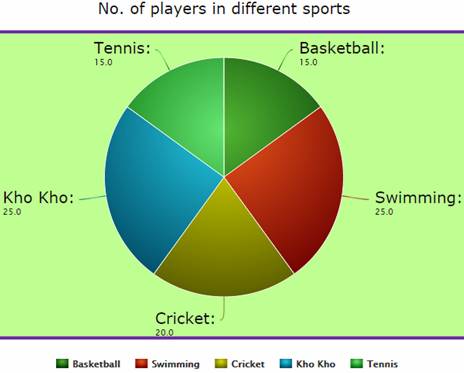
Students of Grade 10 of a school participated in different sports. Study the pie chart carefully and answer the questions.

  1. How many students are there in all ?

(a) 100               (b) 95                  (c) 90                  (d) 110


  1. What fraction of total students are cricket players ?

(a) 1/5                (b) 1/4                (c) 2/5                (d) ¾


  1. What fraction of total students are swimmers ?

(a) 1/5                (b) 1/4                (c) 2/5                (d) ¾


  1. What fraction of total students are basketball players ?

(a) 3/20             (b) 3/10             (c) 4/5                (d) 7/20


  1. What fraction of total students are Tennis players ?

(a) 3/20             (b) 3/10             (c) 4/5                (d) 7/20


  1. What fraction of total students are Kho Kho players ?

(a) 1/4                (b) 1/5                (c) 3/4                (d) 2/5


Answer Key:

(1)-A; (2)-A; (3)-B; (4)-A; (5)-A; (6)-A