Charts and graphs Worksheet-10
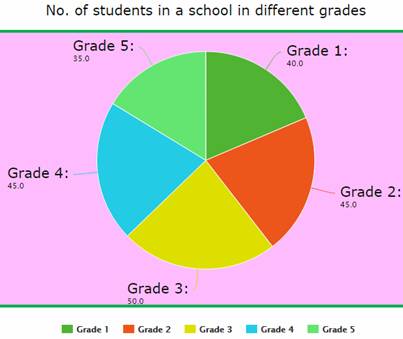
Study the pie chart carefully and answer the questions.
-
What is the total no. of students in all these grades ?
(a) 215 (b) 205 (c) 225 (d) 195
-
Which grade has least no. of students ?
(a) Grade 1 (b) Grade 2 (c) Grade 3 (d) Grade 5
-
Which grade has highest no. of students ?
(a) Grade 1 (b) Grade 2 (c) Grade 3 (d) Grade 5
-
Which two grades have equal no. of students ?
(a) Grade 1 & Grade 3 (b) Grade 2 & Grade 5
(c) Grade 2 & Grade 4 (d) Grade 1 & Grade 4
-
Students of grade 3 is what fraction of total students in the school ?
(a) 10/43 (b) 5/43 (c) 10/23 (d) 5/23
-
How many new admissions took place in grade 3 if no student left school after grade 2 and nobody was fail ?
(a) 5 (b) 4 (c) 0 (d) None of these
-
Grade 4 students are what fraction of grade 3 ?
(a) 3/10 (b) 1/10 (c) 7/10 (d) 9/10
-
1/5 students of grade 5 failed and could not go to next class. How many students were fail in grade 5 ?
(a) 5 (b) 6 (c) 7 (d) 8
-
Half of the students of grade 1 went for picnic. How many students went for picnic ?
(a) 10 (b) 20 (c) 30 (d) 40
-
One day half of the students of grade 3 didn’t do their homework then how many students did their homework ?
(a) 15 (b) 20 (c) 25 (d) 30
Answer Key:
(1)-A; (2)-D; (3)-C; (4)-C; (5)-A; (6)-A; (7)-D; (8)-C; (9)-B; (10)-C