
Charts & Graphs Worksheet-2
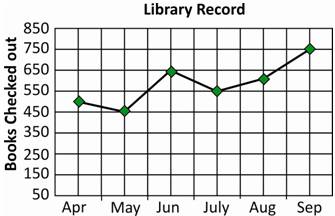
The line chart above shows a library record. See the line chart to answer this Q.1,2,3
A. 650 B. 600 C. 700 D. 550
A. 150 B. 50 C. 1 D. 100
A. 1,650 B. 1,600 C. 1,700 D. 1,200
See the circle/pie chart to answer the following Q.4,5,6,7
A middle school surveyed its students to find out how they commute to school everyday. The data of the survey are presented in the following pie chart.
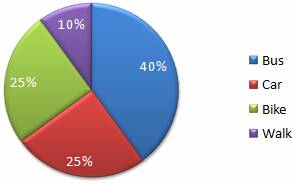
A. 50 B. 10 C. 40 D. 25
A. 50 B. 100 C. 60 D. 10
A. Bus B. Car C. Walk D. Bike
A. Bike and Car B. Car and Bus
C. Bike and Walk D. Bus and Walk
A. 4 B. 20 C. 5 D. 40
A. 6 B. 12 C. 10 D. 10
A. 500 B. 250 C. 150 D. 200
Answer Key:
1. (b); 2. (d); 3. (b); 4. (d); 5. (b); 6. (c); 7. (a); 8. (b); 9. (a); 10. (c)