Logo

Math Olympiad Grade 3 Graphs Worksheet-3

Math Olympiad Grade 3 Graphs Worksheet-3


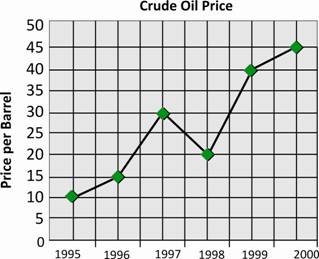
The line chart below shows the variations in crude oil prices from year 1995 to 2000. See the chart to answer this question.

  1. Between which two years was there the greatest increase in crude oil prices?

       A. 1995 - 1996                              B. 1999 – 2000

       C. 1997 - 1998                              D. 1998 – 1999


  1. Which year had the lowest oil price per barrel?

       A. 1997               B. 1999               C. 1995               D. 2000

Click here for more math worksheets

  1. Between which two years the crude oil prices increased by Rs.20 per barrel?

       A. between 1996 and 1997         B. between 1999 and 2000

       C. between 1998 and 1999         D. between 1997 and 1998


  1. Between which two years the crude oil prices decreased by Rs.10 per barrel?

       A. 1997 - 1998                              B. 1995 – 1996

       C. 1999 - 2000                             D. 1996 – 1997


Answers

(21)–D; (22)–C; (23)–C; (24)–A