
Charts & Graphs Worksheet-3
This line graph shows the prices of gasoline in past few years. See the line graph to answer the following question.
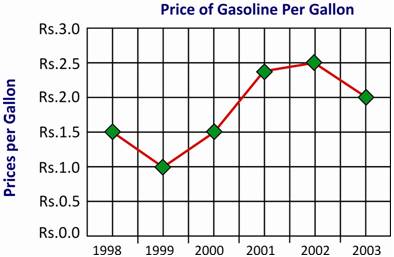
A. Rs.1.50 B. Rs.2.00 C. Rs.2.50 D. Rs.1.00
See more math worksheets for numbers
A. 1999 B. 2000 C. 1998 D. 2001
A. Rs.1.50 B. Rs.1.0 C. Rs..20 D. Rs.0.50
The line graph below shows the height of a growing marigold plant from Monday to Saturday.
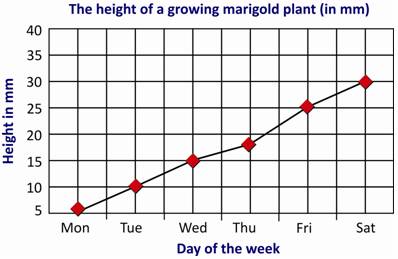
A. 10 mm B. 15 mm C. 20 mm D. 25 mm
A. 25 mm B. 20 mm C. 30 mm D. 35 mm
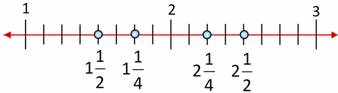
A. 1/(1/2) B. 2(1/4) C. 1(1/4) D. 2(1/2)
The bar graph below shows all the summer programs ABC Public School is offering for its students and the number of students signed-up for each of the program.
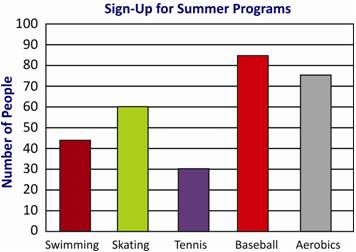
A. 50 B. 42 C. 48 D. 45
A. 135 B. 130 C. 125 D. 115
A. 180 B. 210 C. 234 D. 225
A. 265 B. 315 C. 285 D. 295
Answer Keys
(11)–C; (12)–A; (13)–D; (14)–B; (15)–A; (16)–C; (17)–D; (18)–A; (19)–B; (20)–D