
Data and Graphs Worksheet-2
The pictograph given below shows how many letters were collected from a post box on each of the days of a certain week. (Q.-1,2,3)

(a) 300 (b) 330 (c) 350 (d) 420
(a) 20 (b) 30 (c) 40 (d) 50
(a) 10 (b) 20 (c) 30 (d) 40
(a) Pictograph (b) attractive graph
(c) different graph (d) none
(a) number (b) numerical (c) picture (d) none
(b)
(a) 4 (b) 16 (c) 20 (d) 25
 stands for 30, then
  will stand for
(a) 6 (b) 10 (c) 12 (d) 26
The pictograph given below shows has many persons travelled from city A to city B by bus on each of the days of a certain week:
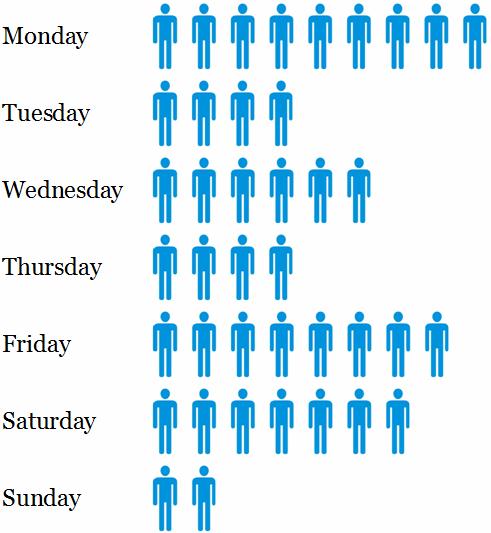
Study the pictograph carefully and answer the questions? (Q.-8,9,10)
(Assume that one  represents 10 persons)
(a) 200 (b) 400 (c) 600 (d) 900
(a) Friday (b) Saturday (c) Sunday (d) Monday
(Assume that one  represents 5 persons)
(a) Rs. 50 (b) Rs. 100 (c) Rs. 150 (d) Rs. 300
Answer Key: