
Data and Graphs Worksheet-3
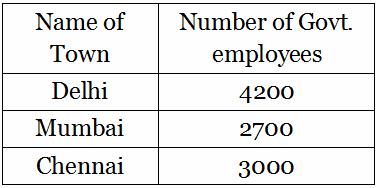
The question is based on this table and pictograph which show the number of Government employees in some towns. (Q.-1,2)
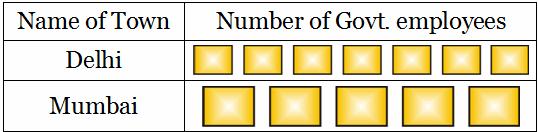
 represent?
(a) 500 (b) 600 (c) 700 (d) 800
(a) 
(b) 
(c) 
(d) 
 Number represented by figures is .........., if each symbol represents 5 hours.
(a) 4 (b) 20 (c) 5 (d) 40
(a) 6 (b) 12 (c) 10 (d) 10
Answer the following set of questions by reading the below pictograph. (Q.-5,6,7,8)
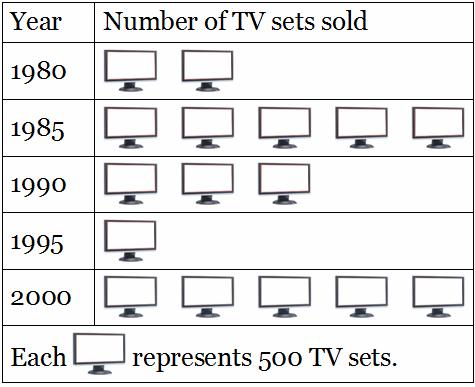
(a) 1000 (b) 500 (c) 50 (d) 2000
(a) 1980 (b) 1985 (c) 2000 (d) 1990
(a) 1000 (b) 1500 (c) 1250 (d) 2000
(a) 1985 (b) 1990 (c) 1980 (d) 2000
 represents 50 children then
  represents number of children.
(a) 5 (b) 25 (c) 15 (d) 20
 represents 5 balloons then number of symbols to be drawn to represent 60 balloons is
(a) 5 (b) 60 (c) 10 (d) 12
Answer Key: