
Data and Graphs Worksheet-4
 represents 10 bottles of apple juice then 35 bottles of apple juice are represented by
(a) 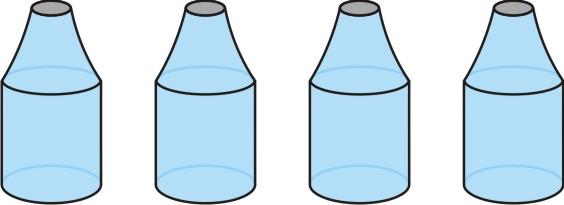
(b) 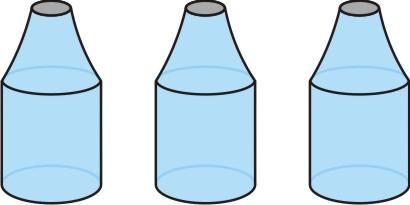
(c) 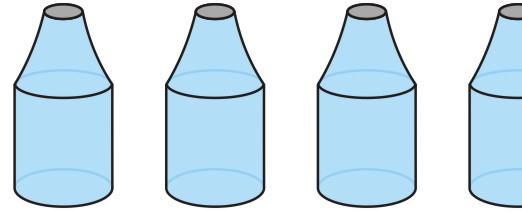
(d) 
(a) pictograph (b) circle graph
(c) column graph (d) line graph
(a) bar graph (b) line graph
(c) pictograph (d) pie graph
Read the shown graph and answer the questions: (Q.-4,5,6)
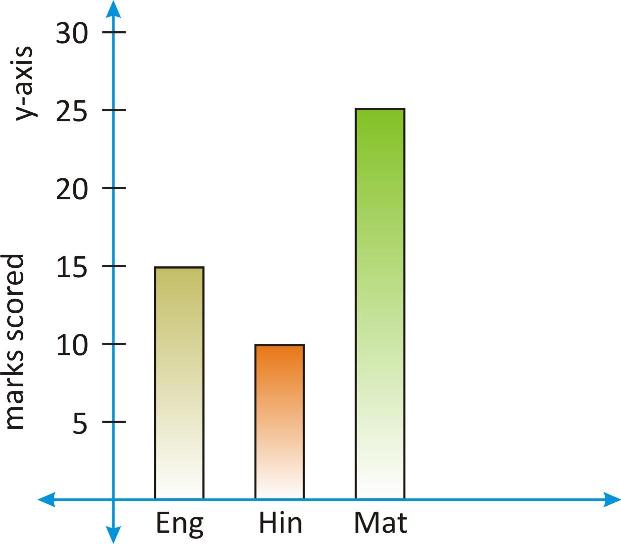
(a) X-axis (b) Y-axis (c) line (d) None
(a) Y-axis (b) X-axis (c) Ray (d) None
(a) English (b) Hindi (c) Maths (d) None
(a) attractive graph (b) pictograph
(c) bar graph (d) pi diagram
(a) pictograph (b) graph
(c) picture graph (d) none
(a) picture (b) number
(c) numerical (d) none of these
 represents 12 men then how many men does
  represent?
(a) 5 (b) 50 (c) 6 (d) 60
Answer Key: