Logo

Data and Graphs Worksheet-5

Data and Graphs Worksheet-5


Given below is a bar graph showing the heights of six mountain peaks

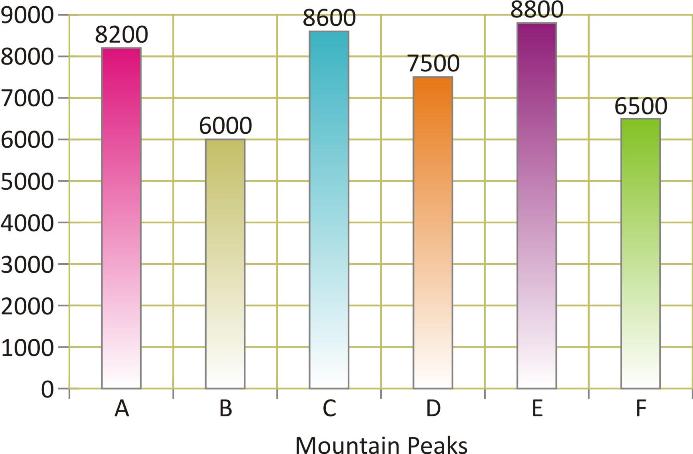
Read the above diagram and answer the following: (Q.-1,2,3,4)


  1. Which is the highest peak?

(a) A                    (b) E                  (c) C                    (d) B


  1. Write the ratio of the heights of highest peak and the lowest peak.

(a) 22 : 15          (b) 15 : 22          (c) 20 : 13          (d) 13 : 22


  1. Which peak is second highest?

(a) B                   (b) A                   (c) C                    (d) E


  1. When the heights of the given peaks are written in ascending order, then what is the average of the middle two peaks?

(a) 7950 m        (b) 7560 m        (c) 7650 m         (d) 7850 m


Read the following graph and answer the questions. (Q.-15,6,7,8,9)

  1. At what subject is the student sharp?

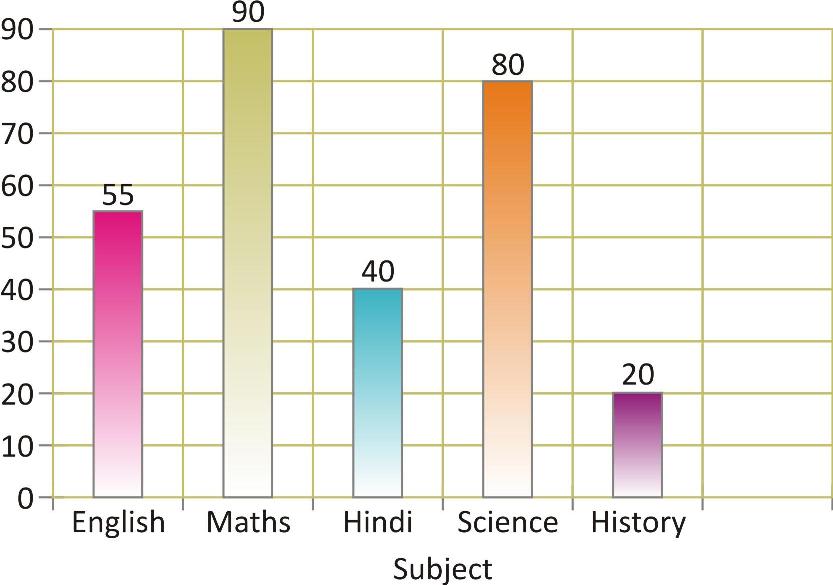
(a) English                                     (b) Mathematics

(c) Science                                     (d) History


  1. In which subject is the student poor?

(a) English                                     (b) Mathematic

(c) Science                                     (d) History


  1. What are the average marks obtained by the student?

(a) 57                  (b) 63                 (c) 80                 (d) 48


  1. What is the percentage obtained by the student?

(a) 80%              (b) 63%              (c) 57%               (d) 90%


  1. What is the ratio of the highest marks to the lowest marks obtained by the student?

(a) 2 : 11             (b) 9 : 2              (c) 2 : 9              (d) 11 : 2


Answer Key:

  1. (b)
  2. (a)
  3. (c)
  4. (d)
  5. (b)
  6. (d)
  7. (a)
  8. (c)
  9. (b)