Charts & Graphs Worksheet-1
-
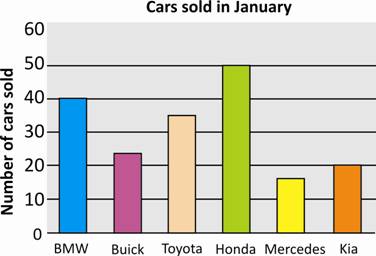
According to the bar chart, which car had maximum sale?
A. Buick B. Toyota C. Honda D. BMW
-
How many more Honda cars than BMW cars were sold?
A. 50 B. 40 C. 30 D. 10
-
How many more Buick cars than Mercedes cars were sold?
A. 30 B. 10 C. 25 D. 20
-
How many less Kia cars than Toyota cars were sold in January?
A. 10 B. 40 C. 15 D. 25
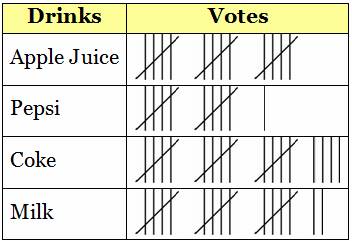
A school cafeteria conducted a survey among children about their preferred drinks with lunch.
-
The data collected were shown in the tally chart. What is the most popular drink?
A. Apple Juice B. Pepsi C. Coke D. Milk
-
How many children chose Pepsi as their favorite drink?
A. 15 B. 11 C. 17 D. 19
-
How many people answered the survey?
A. 63 B. 55 C. 45 D. 62
-
What is the least popular drink?
A. Apple Juice B. Pepsi
C. Coke D. Milk
-
How many children liked milk and apple juice?
A. 17 B. 15 C. 32 D. 33
-
How many children preferred coke?
A. 15 B. 13 C. 11 D. 19
-
How many children responded to the survey?
A. 65 B. 62 C. 45 D. 55
Answers
(1)–C; (2)–D; (3)–B; (4)–C; (5)–C; (6)–B; (7)–D; (8)–B; (9)–C; (10)–D; (11)–B