
Charts & Graphs Worksheet-2
See the line chart to answer the questions.
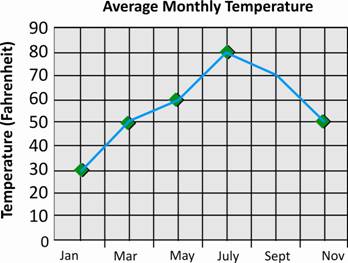
A. January and March B. September and November
C. July and September D. May and July
A. 30 degree Fahrenheit B. 45 degree Fahrenheit
C. 20 degree Fahrenheit D. 50 degree Fahrenheit
A. March and July B. July and January
C. March and November D. March and September
A survey was conducted among people to know their favorite hill stations in India.
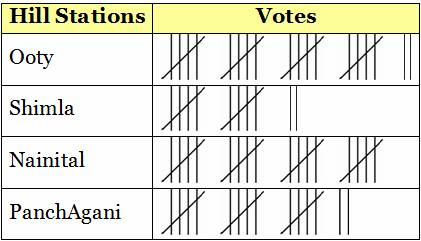
A. 12 B. 16 C. 20 D. 13
A. Ooty B. Shimla C. Panchgani D. Nainital
A. 16 B. 5 C. 3 D. 4
A. Panchgani, Nainital, Ooty, Shimla
B. Ooty, Nainital, Panchgani, Shimla
C. Shimla, Ooty, Panchgani, Nainital
D. Ooty, Shimla, Nainital, Panchgani
A. 25 B. 44 C. 37 D. 51
A. 29 B. 19 C. 33 D. 13
Answers
(12)–B; (13)–D; (14)–C; (15)–A; (16)–A; (17)–B; (18)–B; (19)–D; (20)–A