EXPERIMENTS/ACTIVITIES
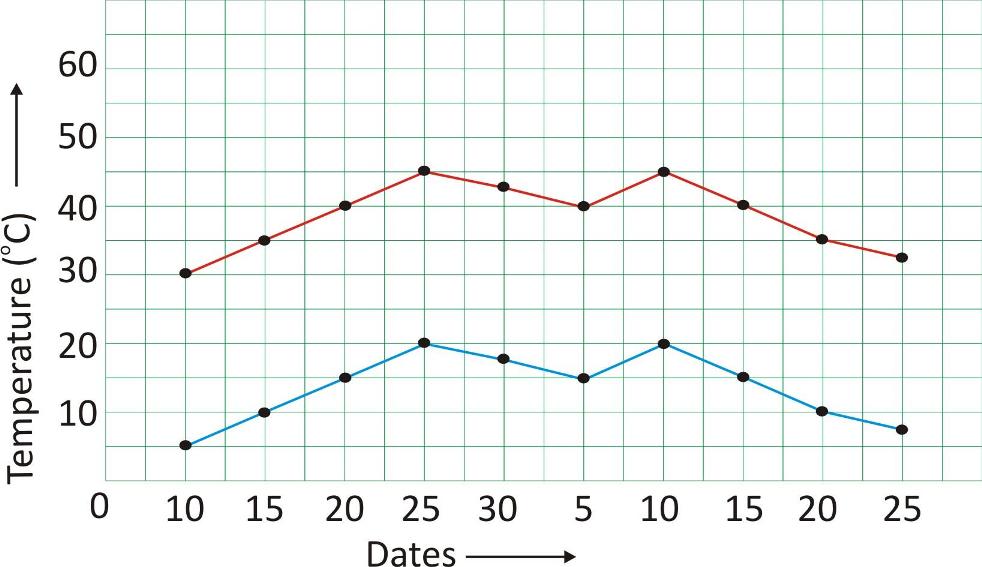
An Experiment to Show Daily Changes in Temperature By Plotting A Graph:
Requirements:
-
A centimeter graph sheet, temperature data from the local newspaper for 55 days, red and blue pencils
Procedure:
-
Note down the date and the maximum and minimum temperatures from the newspaper for 55 days.
-
On a graph sheet, plot the date on the x-axis and the corresponding maximum temperatures on the y-axis.
-
Join these points with a red pencil to get the maximum temperature graph.
-
Repeat Step 2 for the minimum temperatures. Now join the points with the blue pencil to get the minimum temperature graph.
Observation:
-
A curved graph is obtained. A red line shows the maximum temperature and blue line shows the minimum temperature.
Conclusion:
-
Maximum and minimum temperatures change.
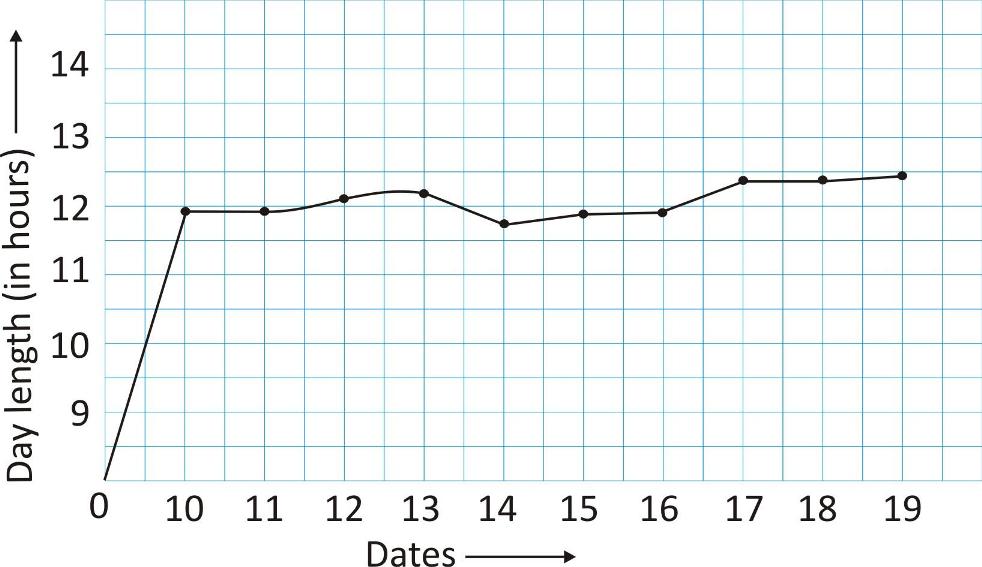
An Experiment to Show Changes in Length of the Day By Plotting A Graph:
Requirements:
-
A centimeter graph sheet, data from the local newspaper for at least ten days, a sharp pencil, and an eraser
Procedure:
-
Note the time of sunrise and sunset from the daily newspaper for ten consecutive days.
-
Find the difference in the times to get the duration of each day, i.e., day length.
-
On a graph sheet, plot the date on the x-axis and the day length on the y-axis.
Observation:
-
A curved graph is obtained.
Conclusion:
-
Length of a day changes throughout the year.
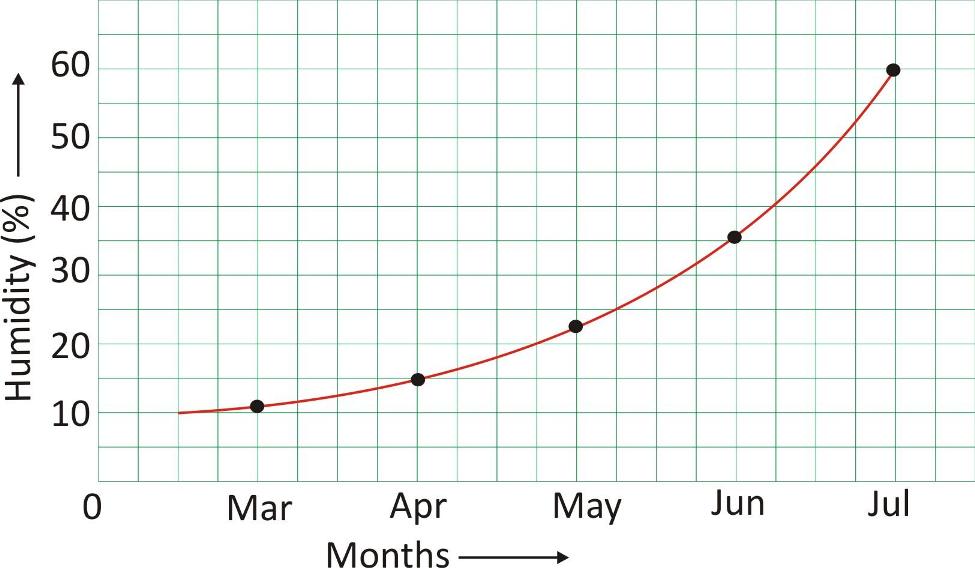
An Experiment to Show Daily Changes In Humidity By Plotting A Graph:
Requirements:
-
A centimeter graph sheet, data from the local newspaper for at least five months, a sharp pencil, and an eraser
Procedure:
-
Note the humidity content given in the weather report of the daily newspaper for five months.
-
Plot the date on the x-axis and the humidity on the y-axis.
-
Note down the trend that is observed in the graph.
Observation:
-
A curved graph is obtained.
Conclusion:
-
Humidity is not the same every month. Sometimes it is low and sometimes high.
-
As climate differs from place to place, different animals adapt to these climates.